Overview
Pallas Charts includes a dedicated admin page for Jira site admins, separate from any single gadget. Open it from the Apps menu in Jira's main navigation — choose Pallas Charts. (It's also available under Jira Settings → Apps.) The page is admin-only: anyone without Jira administrator rights who opens it simply sees a notice pointing them to their admin. The settings here set guardrails and sensible defaults for every Pallas Charts gadget on your site — your teams keep full freedom; these settings simply define the envelope they work within.
Settings cascade in one direction: org-wide defaults → per-gadget overrides → per-user exceptions. The cascade is applied each time a gadget loads, so a change you make here reaches every gadget on the site immediately — nobody has to re-save their gadget.
One thing the admin page never changes: charts always run as the person viewing them, so a chart can only ever show issues that user can already see in Jira. These settings scope and shape what charts show — they don't override Jira's own access controls.
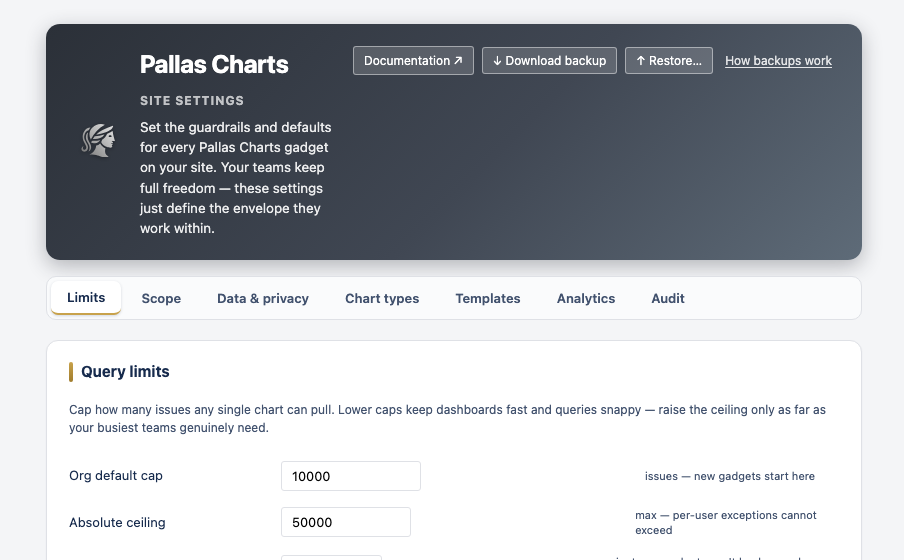
Query limits
Cap how many issues a single chart can pull. Lower caps keep dashboards fast and queries snappy.
- Org default cap — the limit new gadgets start with.
- Absolute ceiling — a hard maximum that no per-user exception can exceed.
- Per-user exceptions — give specific people (e.g. a data analyst who genuinely charts tens of thousands of issues) a higher cap. Search for the person and set their limit.
- Auto-refresh floor — the minimum interval between a gadget's background refreshes, so dashboards don't re-query too often.
Query scope
Set a site-wide JQL prefix that's automatically added to every gadget's query. For example, a prefix of project in (WEB, API) keeps every chart on the site focused on those projects. A prefix can only ever narrow results — it's combined with each gadget's own query, never widening it.
This is a scoping and governance convenience — not a permission control. Jira's own permissions still decide what each viewer can see; the prefix just trims the default field of view. It applies to JQL and basic-filter charts (not sprint charts). For per-dashboard scoping, set the query on the individual gadget instead.
Brand font
Pick one font for everything on this site — the gadget controls and the chart text itself (axis labels, legends, values) all share it, so a chart never looks mismatched against the UI around it. A small preview updates as you choose.
- System default — mirrors Jira's own font, so charts feel native on the dashboard. Recommended unless you have a reason to change.
- A brand face — choose from a curated set of widely-available fonts (e.g. a clean sans or a classic serif) to match your organisation's look.
The choice applies everywhere immediately — every gadget on the site, without anyone re-saving — and individual gadgets can't override it, so the look stays consistent. Technical details like JQL and field IDs always stay in a monospace font for legibility, whatever you pick.
Data & privacy
Pallas Charts never stores your issue data. Every chart queries Jira live as the person viewing it and keeps the result only in memory for that session — nothing is written to storage, on Atlassian or anywhere else.
- Because each gadget runs as the viewer, a chart can only ever contain issues that person already has permission to see in Jira. Pallas Charts never elevates permissions.
- With nothing kept at rest, there is nothing to configure or purge here — this tab simply confirms the posture. The trade-off is a brief load on each view instead of an instant repaint from a stored copy.
That makes Pallas Charts a strong fit for teams with strict “don't persist our issue data” policies.
Chart types
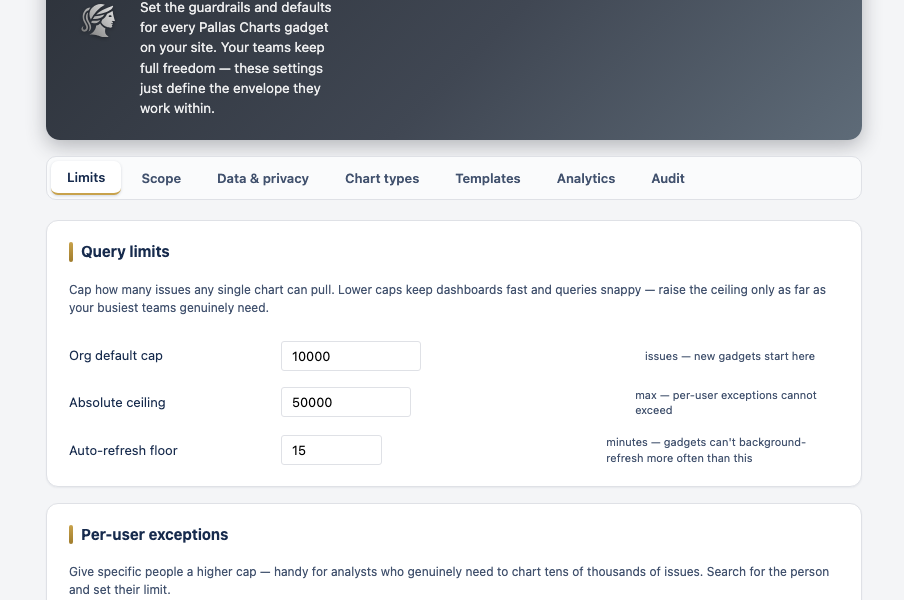
A built-in catalog of every chart type your teams can build — what each one is and what it's best for — so you have a quick reference to share with users. Each is available by default; flip a type off to remove it from the chart picker and suggestions site-wide (reversible at any time).
Templates
Two ways templates reach your teams. Publish a curated template here and it appears under the Org category in every gadget's gallery. And whenever anyone uses Save as template on a chart, it's shared org-wide automatically under the Team category — so good setups spread without you lifting a finger.
You manage the whole shared pool from this tab: hide a template to drop it from everyone's gallery (reversible), or delete it outright. You can also hide built-in templates that don't apply — for example, an ITSM-only team hiding the sprint templates.
Usage analytics
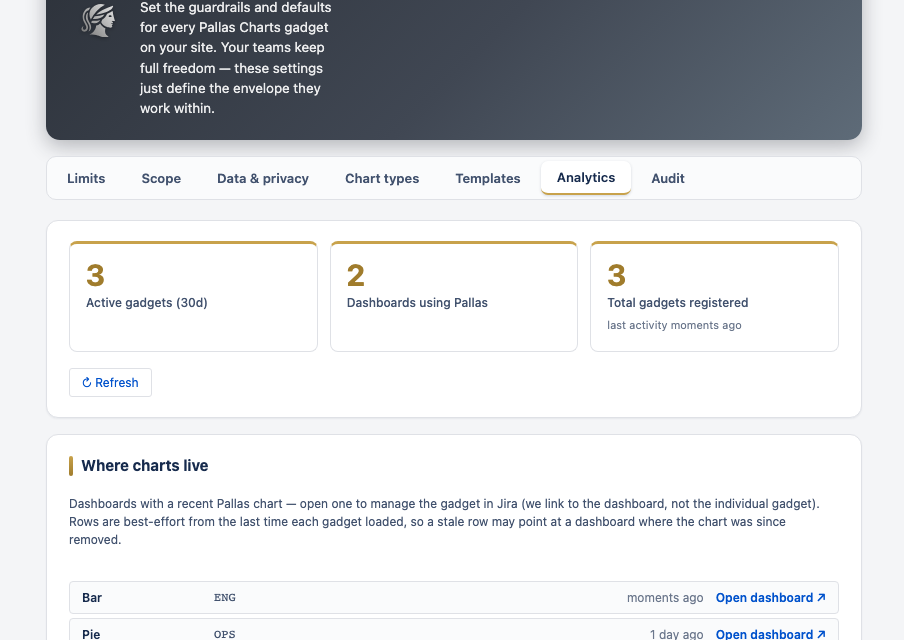
See how Pallas Charts is used across your site: active gadget count, the most popular chart types, which projects are charted most, template adoption, and export usage — useful numbers for justifying the licence and spotting what your teams actually rely on.
It also includes a Where charts live list: every dashboard with a recent Pallas chart, each linked so you can open it and manage the gadget in Jira directly.
Privacy: these analytics are built from a small fingerprint of each gadget — its chart type, project keys, and issue types only. They never include the raw JQL or any user-typed content.
Audit log
Every change to org settings is recorded — what changed, who changed it, and when — so you always have a clear history of admin actions on the site.
Backup & restore
From the admin header you can download a single JSON file capturing all your org settings and templates, and restore it later or on another site. A How backups work link in the header explains the details. Two things to keep in mind:
- Restore overwrites everything — it replaces settings and templates wholesale, it doesn't merge.
- Config only — a backup never includes chart data, usage analytics, or the audit log, so restoring it never touches anyone's issue data or what they can see.
Need Additional Help?
If you have any questions or need assistance, our support team is here to help