{ Pallas Charts }
Your Jira data,
beautifully visualized.
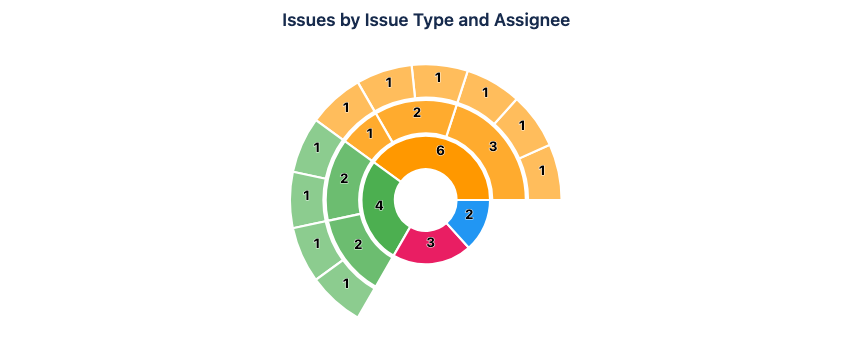
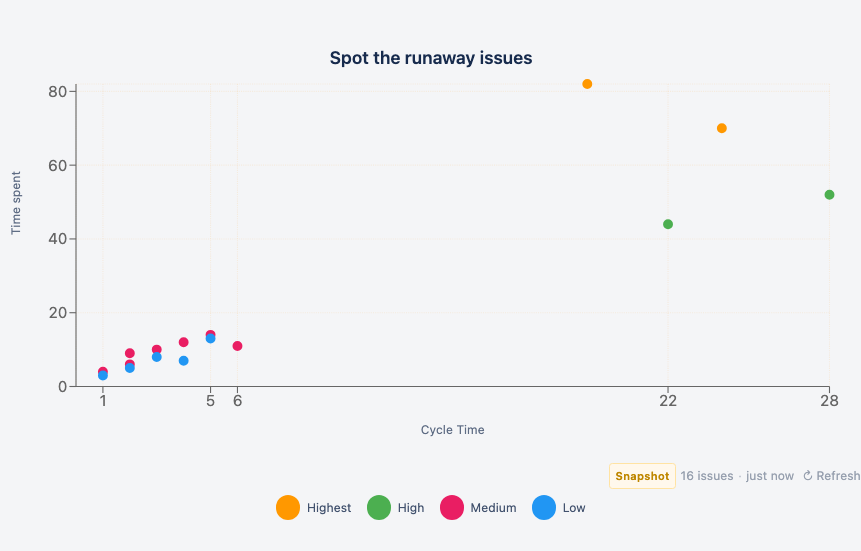
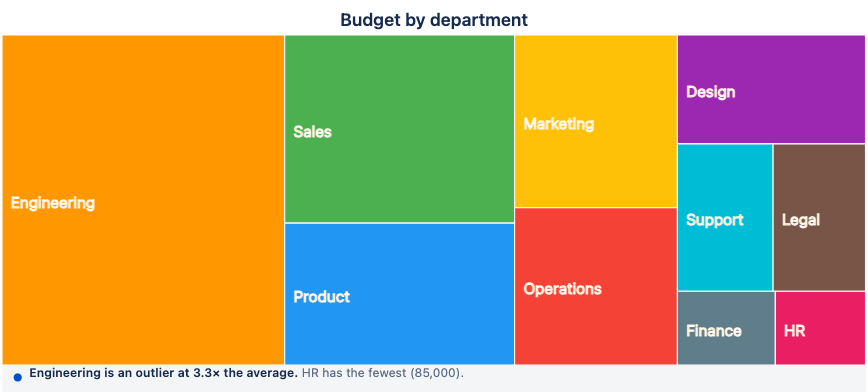
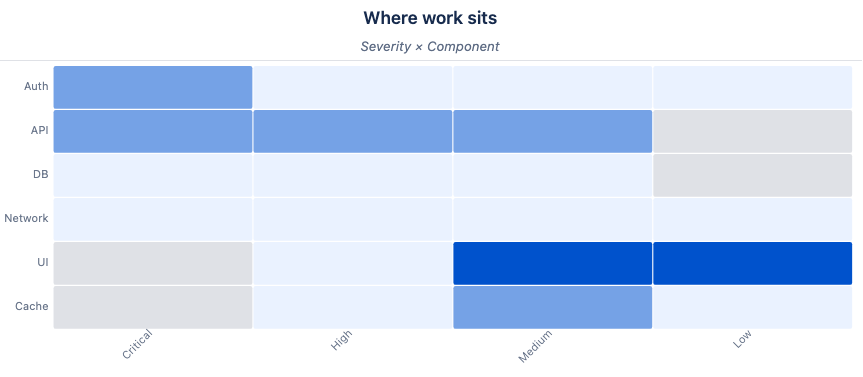
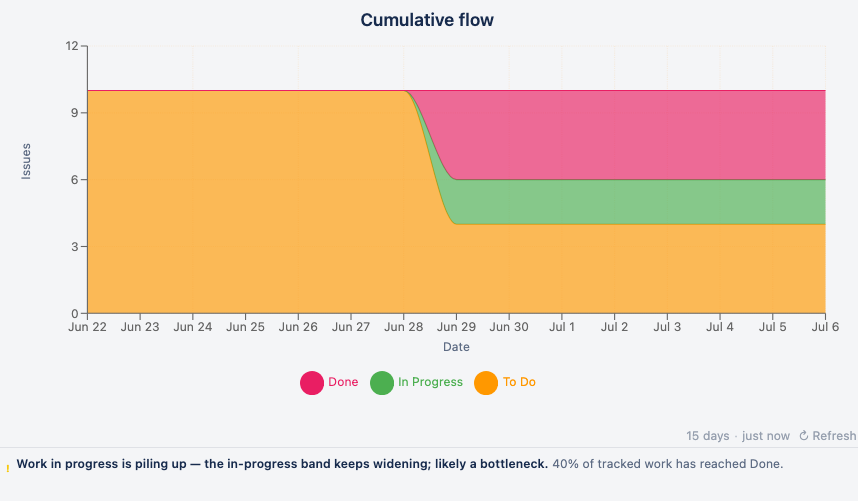
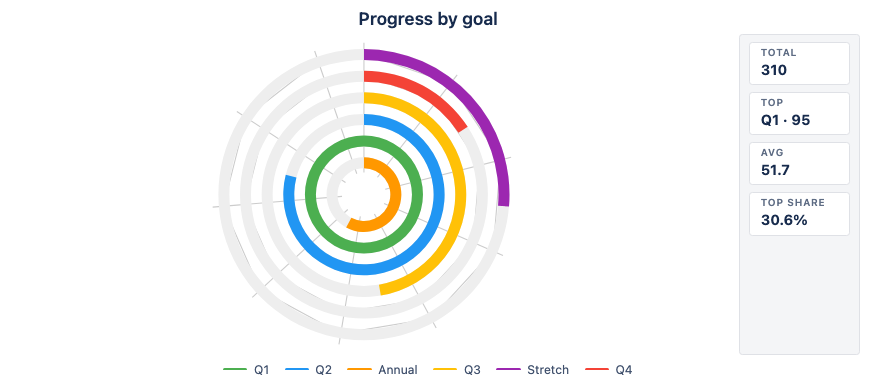
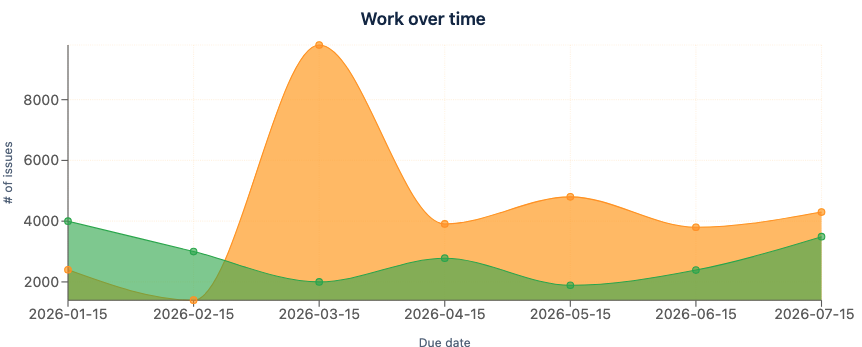
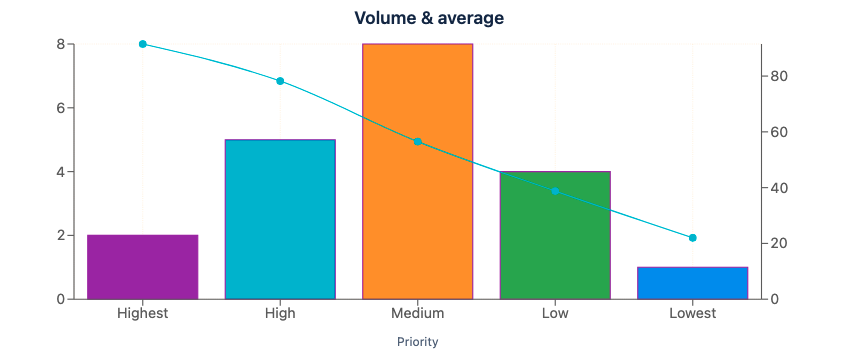
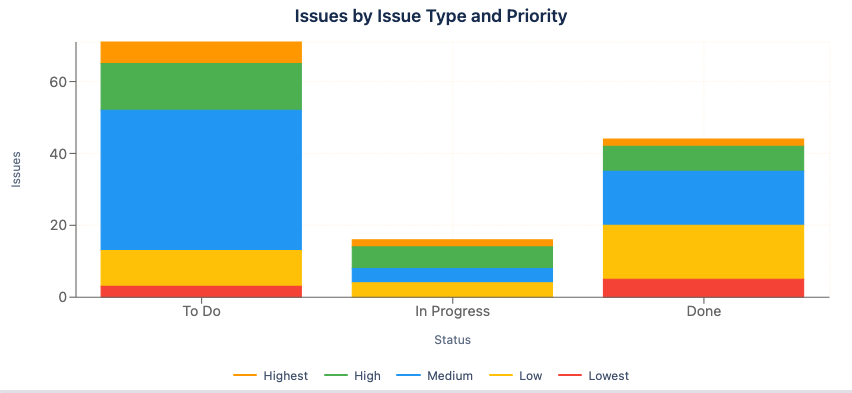
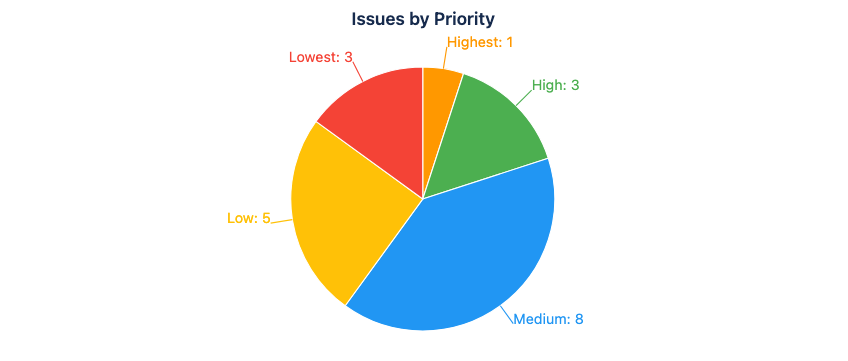
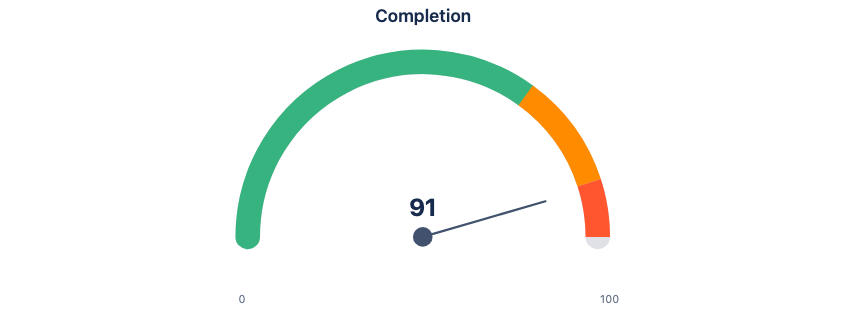
Twenty-plus chart types — from bar and burndown to treemap and forecast — right on your dashboard. Good-looking defaults, no setup headaches, and charts that explain themselves.
Beautiful out of the box

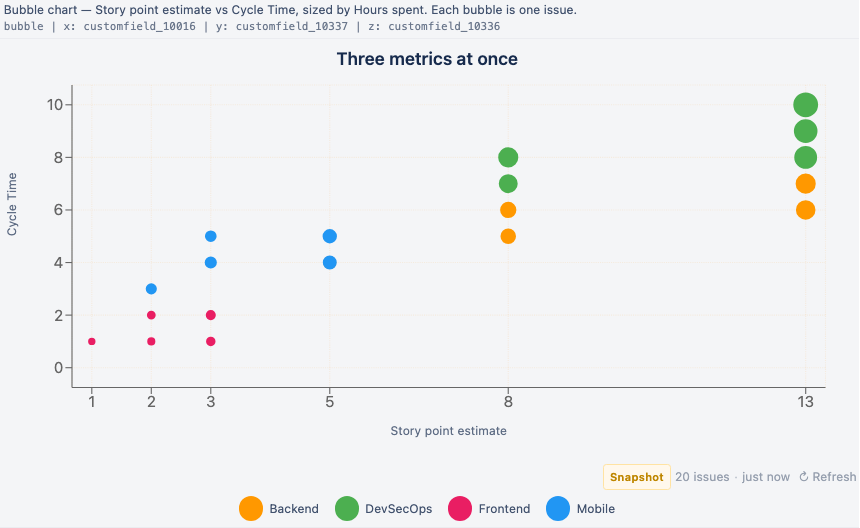
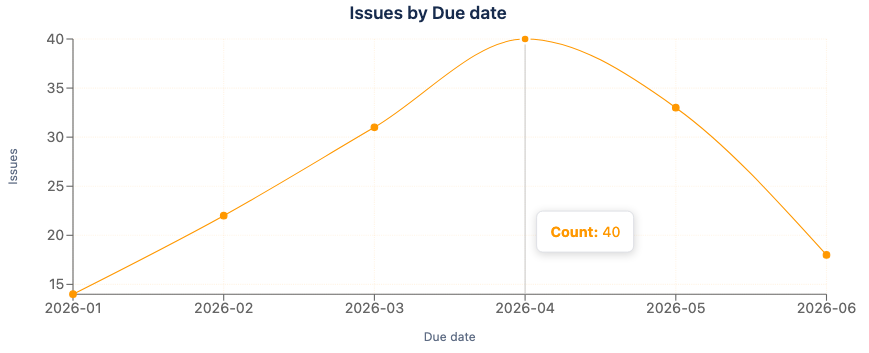
Point a chart at a JQL query or your usual Jira filters — sensible colors, labels and layout come for free. Pick the type, and a polished chart appears in seconds.


See it in action
More than a pretty picture.
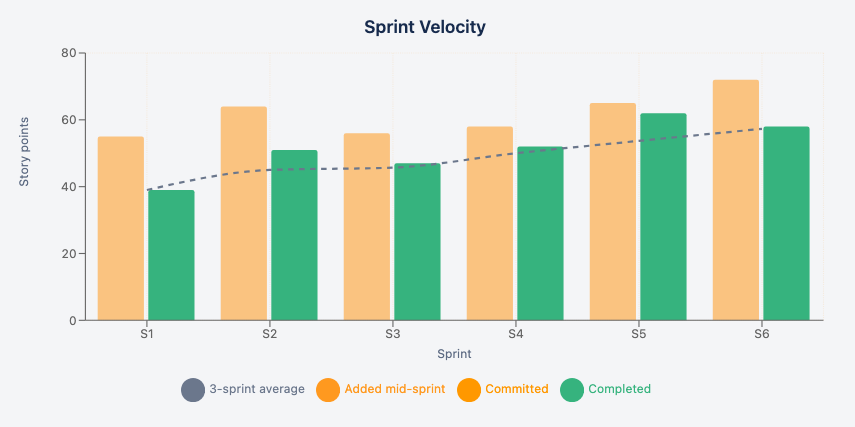
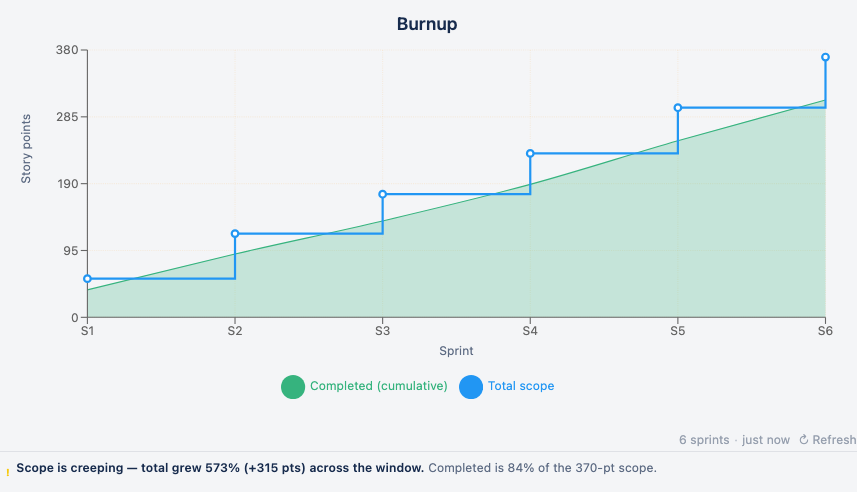
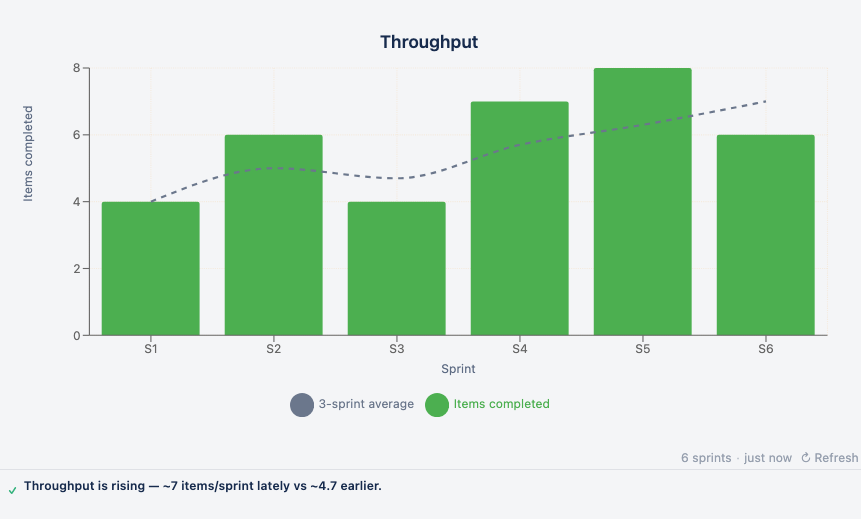
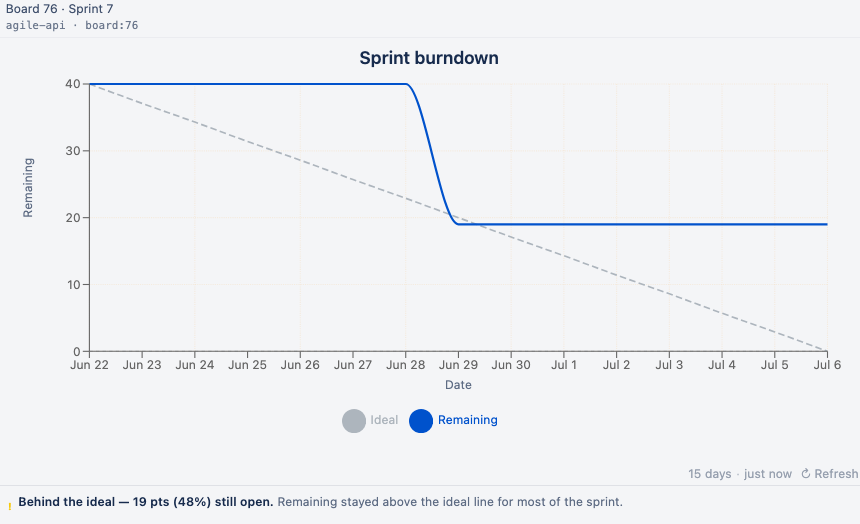
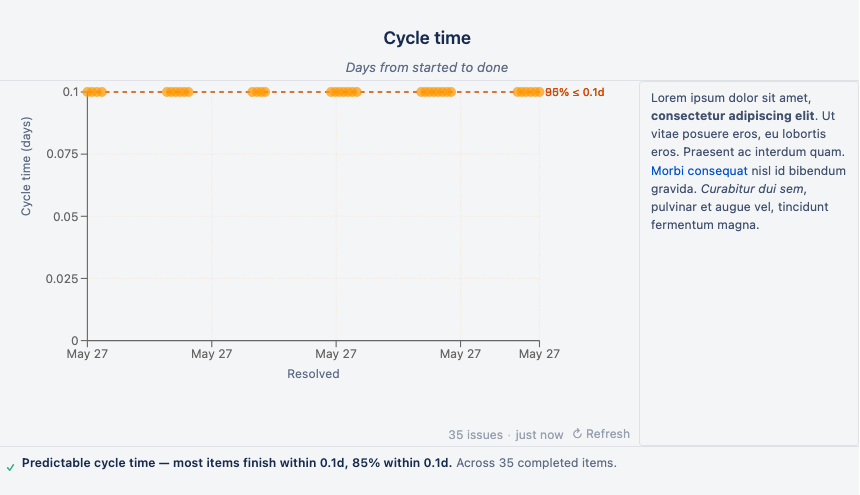
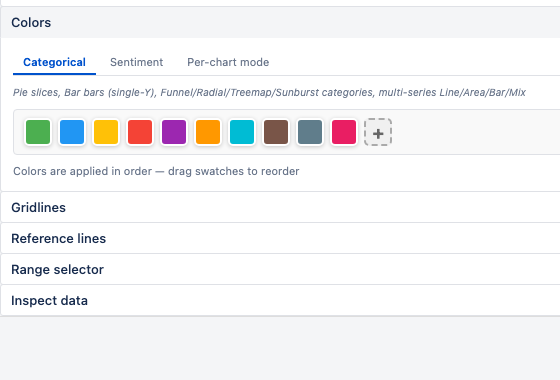
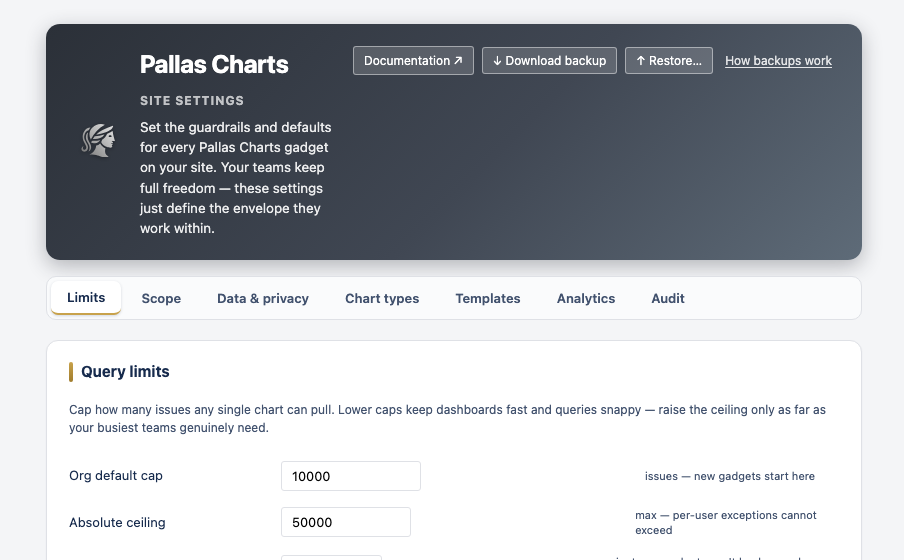
Every sprint chart writes its own plain-English summary — trends, risks and wins — so the whole team reads the story, not just the shape. Tune colors, layout and axes to match your brand, and admins set guardrails for the whole site.
Learn More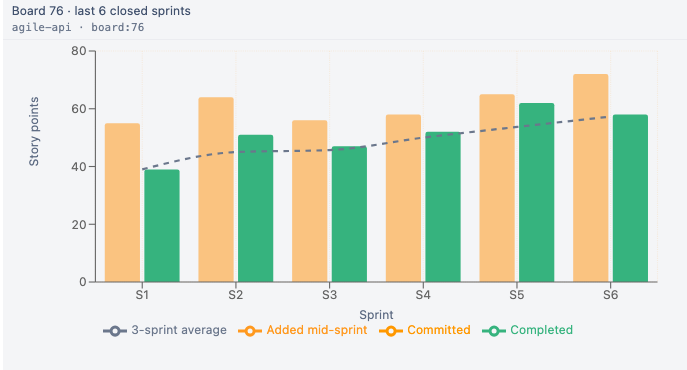
Built for what teams actually want.
What teams keep asking for
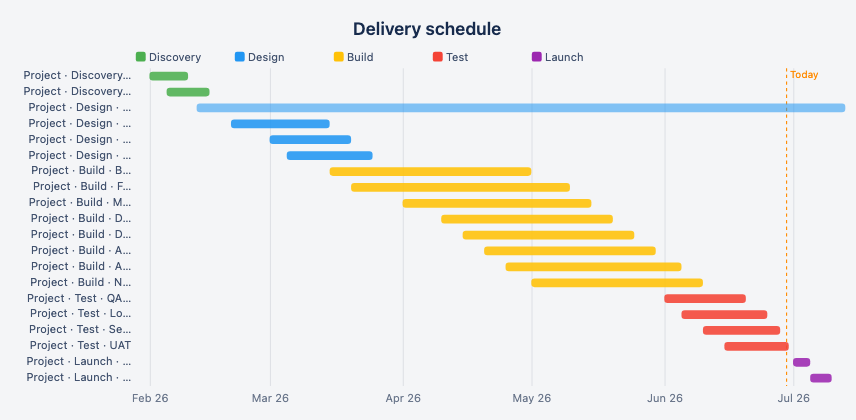
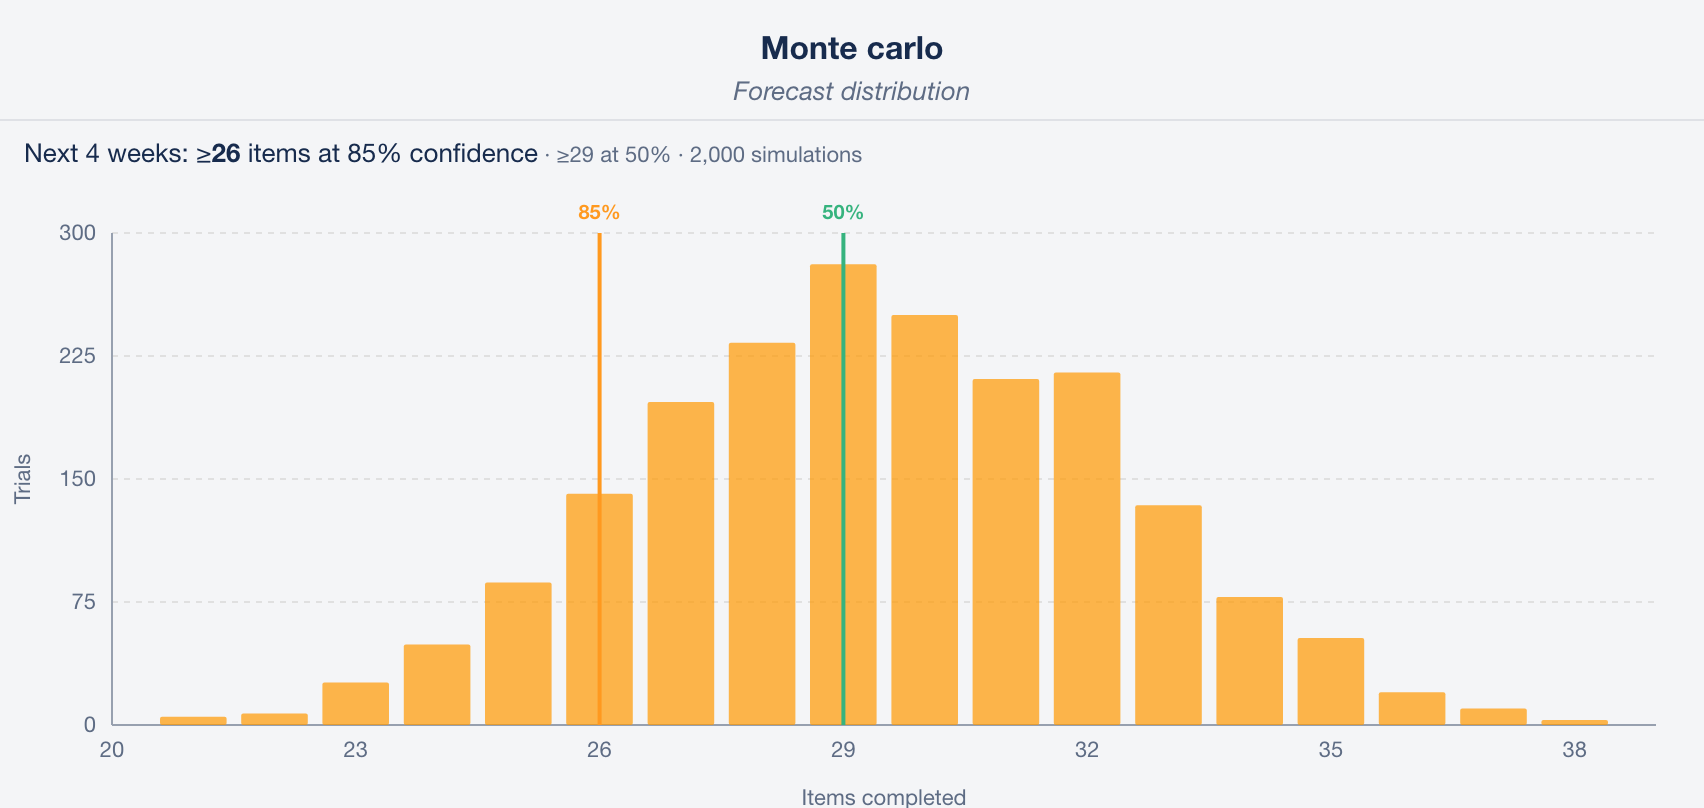
- Every chart in one place — 22 types, from bar and burndown to treemap, sunburst, Gantt and Monte Carlo forecasting.
- One-click reporting templates — velocity, cycle time, CFD and more, built for team leads, not just admins.
- Export anywhere — CSV, Excel, PNG and PDF, straight into a deck or a spreadsheet.
- It guides you — point it at a query and it suggests the right chart. No blank-gadget guesswork.
Only in Pallas Charts
- A filter builder inside the gadget — click to shape your data; no raw JQL required.
- Charts that explain themselves — every sprint chart writes its own plain-English read.
- Built for the whole team — polished enough for execs, deep enough for developers.
- Gantt on your dashboard — project timelines almost no gadget puts there.
Add it to your Jira site
Pallas Charts is on the Atlassian Marketplace — install it on your Jira dashboards in a couple of clicks. New to it? Start with the docs.