Add the gadget
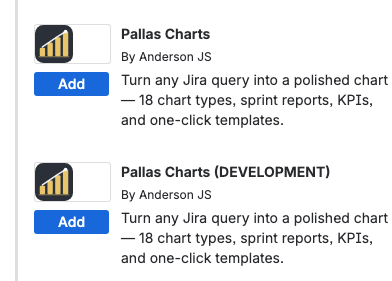
First, install Pallas Charts from the Atlassian Marketplace (a Jira admin may need to approve it). Then open any Jira dashboard, choose Add gadget, and find Pallas Charts in the list. Once added, the gadget opens in edit mode, ready to configure — no setup or access tokens required.
Connect your data
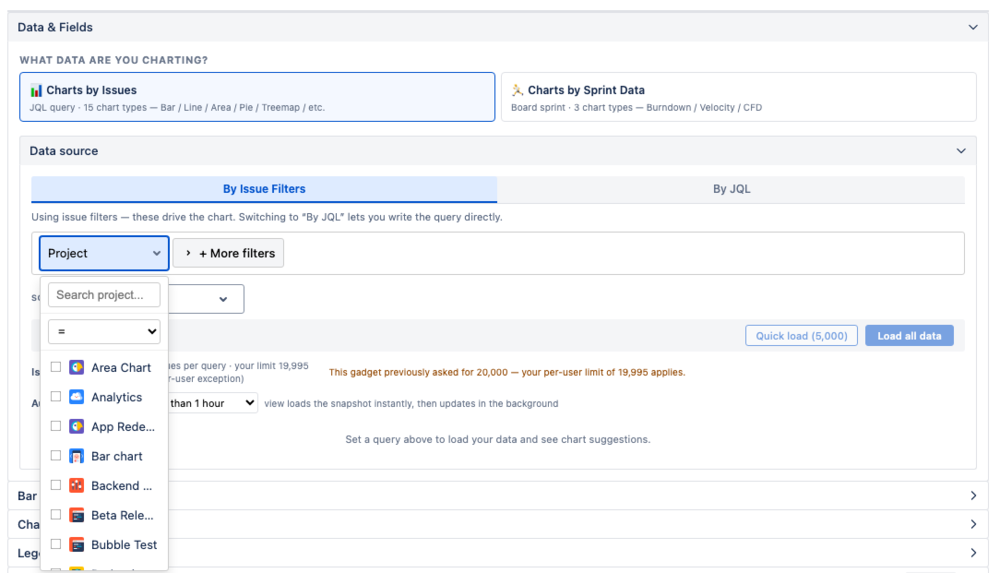
Every chart is built from a set of Jira issues. Pick them with Basic filters — simple dropdowns for project, issue type, status, assignee, and more — or switch to JQL for full control. The preview updates automatically as you refine the query, and a live count tells you how many issues match.
Note: Pallas Charts never stores your Jira data. Each chart queries Jira live as the person viewing it and keeps the result only in memory while the dashboard is open — nothing is written to storage, so charts always reflect the latest issues.
Choose a chart
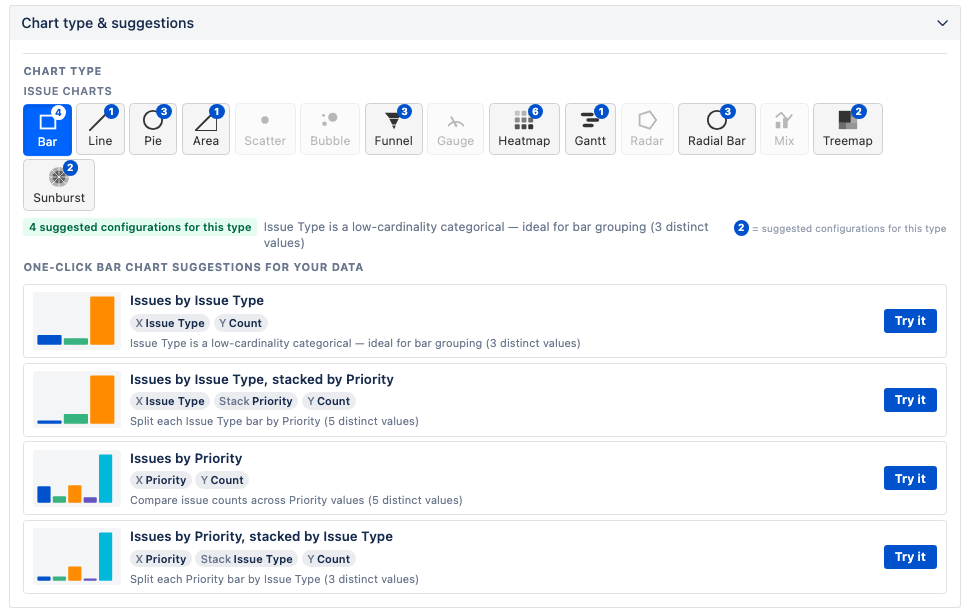
Pick from more than twenty chart types. Based on the fields in your results, Pallas Charts suggests sensible defaults so you reach a good first chart in a click or two — you can change the type, fields, and styling at any time.
New to deciding how a chart should read your data? Start with Understanding your data →, then browse the full list in Chart types →.
Save & view
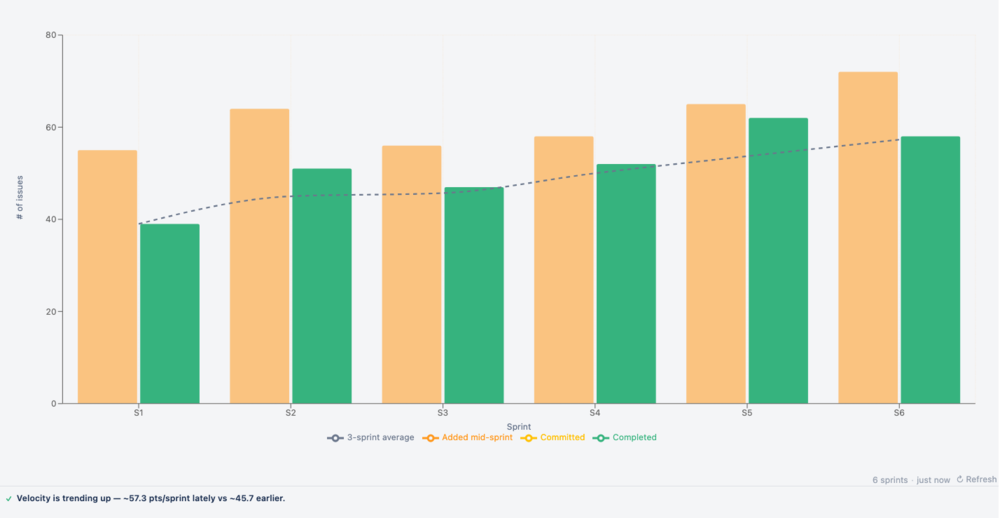
Click Save and the chart renders on your dashboard, querying Jira live for the latest issues. The footer below the chart shows when the data was loaded and a ↻ Refresh button to re-query Jira on demand.
Need Additional Help?
If you have any questions or need assistance, our support team is here to help